Titanic Dataset is a classic Dataset for classfication problem in data science Competition platform: Kaggle. You can reach this introductory competition here Through this project, I will walk through the entire data science pipeline, data collection, data manipulation, data wraggling, data visulization, data modeling and data evaluation. Machine learning techniques include logistic regression, SVM, decisioni trees, random forests and neural networks.
This is the first part of the whole project. The codes is run on Python.
import important packages
import pandas as pd
import matplotlib.pyplot as plt
import seaborn as sns
import numpy as np
Read titanic traning dataset
titanic = pd.read_csv('train.csv')
Check the first 5 rows of train dataset
titanic.head()
| PassengerId | Survived | Pclass | Name | Sex | Age | SibSp | Parch | Ticket | Fare | Cabin | Embarked | |
|---|---|---|---|---|---|---|---|---|---|---|---|---|
| 0 | 1 | 0 | 3 | Braund, Mr. Owen Harris | male | 22.0 | 1 | 0 | A/5 21171 | 7.2500 | NaN | S |
| 1 | 2 | 1 | 1 | Cumings, Mrs. John Bradley (Florence Briggs Th... | female | 38.0 | 1 | 0 | PC 17599 | 71.2833 | C85 | C |
| 2 | 3 | 1 | 3 | Heikkinen, Miss. Laina | female | 26.0 | 0 | 0 | STON/O2. 3101282 | 7.9250 | NaN | S |
| 3 | 4 | 1 | 1 | Futrelle, Mrs. Jacques Heath (Lily May Peel) | female | 35.0 | 1 | 0 | 113803 | 53.1000 | C123 | S |
| 4 | 5 | 0 | 3 | Allen, Mr. William Henry | male | 35.0 | 0 | 0 | 373450 | 8.0500 | NaN | S |
Check the attributes we got
titanic.info()
<class 'pandas.core.frame.DataFrame'>
RangeIndex: 891 entries, 0 to 890
Data columns (total 12 columns):
PassengerId    891 non-null int64
Survived       891 non-null int64
Pclass         891 non-null int64
Name           891 non-null object
Sex            891 non-null object
Age            714 non-null float64
SibSp          891 non-null int64
Parch          891 non-null int64
Ticket         891 non-null object
Fare           891 non-null float64
Cabin          204 non-null object
Embarked       889 non-null object
dtypes: float64(2), int64(5), object(5)
memory usage: 83.6+ KB
From Kaggle’s website, we can clearly see the meaning of each attribute
| Variable | Definition | Key | | ———— | ————– | ————— | | survival | Survival | 0 = No, 1 = Yes | | pclass | Ticket class | 1 = 1st, 2 = 2nd, 3 = 3rd | | sex | Sex | | Age | Age in years | | sibsp | # of siblings / spouses aboard the Titanic | | parch | # of parents / children aboard the Titanic | | ticket | Ticket number | | fare | Passenger fare | | cabin | Cabin number | | embarked | Port of Embarkation | C = Cherbourg, Q = Queenstown, S = Southampton |
Get the descriptive statistics of each column (only for numberic variables)
titanic.describe()
| PassengerId | Survived | Pclass | Age | SibSp | Parch | Fare | |
|---|---|---|---|---|---|---|---|
| count | 891.000000 | 891.000000 | 891.000000 | 714.000000 | 891.000000 | 891.000000 | 891.000000 |
| mean | 446.000000 | 0.383838 | 2.308642 | 29.699118 | 0.523008 | 0.381594 | 32.204208 |
| std | 257.353842 | 0.486592 | 0.836071 | 14.526497 | 1.102743 | 0.806057 | 49.693429 |
| min | 1.000000 | 0.000000 | 1.000000 | 0.420000 | 0.000000 | 0.000000 | 0.000000 |
| 25% | 223.500000 | 0.000000 | 2.000000 | 20.125000 | 0.000000 | 0.000000 | 7.910400 |
| 50% | 446.000000 | 0.000000 | 3.000000 | 28.000000 | 0.000000 | 0.000000 | 14.454200 |
| 75% | 668.500000 | 1.000000 | 3.000000 | 38.000000 | 1.000000 | 0.000000 | 31.000000 |
| max | 891.000000 | 1.000000 | 3.000000 | 80.000000 | 8.000000 | 6.000000 | 512.329200 |
There are some missing values in Age column
-
Data Visualization
Visualize some columns
Visualize the distributions of Survivial
survive = titanic['Survived']
survive.value_counts()
0    549
1    342
Name: Survived, dtype: int64
More people did not survive
sns.countplot(x='Survived',data=titanic)
<matplotlib.axes._subplots.AxesSubplot at 0x2341656f278>

Visualize the distribution of sex
titanic['Sex'].value_counts()
male      577
female    314
Name: Sex, dtype: int64
sns.countplot(x='Sex',data=titanic)
<matplotlib.axes._subplots.AxesSubplot at 0x23416696e80>

Visualize the distribution of Age
#sns.distplot(titanic['Age']) #error because of missing values
Drop null values in age
sns.distplot(titanic['Age'].dropna())
<matplotlib.axes._subplots.AxesSubplot at 0x234168005c0>

Use Pandas built-in visualization
titanic['Age'].hist(bins=30)
<matplotlib.axes._subplots.AxesSubplot at 0x23418c44668>

titanic['Age'].plot(kind='hist')
<matplotlib.axes._subplots.AxesSubplot at 0x23418b92438>

Visualize the distribution of PClass
titanic['Pclass'].value_counts()
3    491
1    216
2    184
Name: Pclass, dtype: int64
Visualize the distribution of Parch # parents/children
sns.countplot(x='Pclass',data=titanic)
<matplotlib.axes._subplots.AxesSubplot at 0x2341eb8aa90>

Visualize fares
plt.figure(figsize=(10,3))
titanic['Fare'].hist(bins=30)
<matplotlib.axes._subplots.AxesSubplot at 0x2341ece6b00>

sns.distplot(titanic['Fare'])
<matplotlib.axes._subplots.AxesSubplot at 0x2341edcf630>

There might be some outliers in the Fare Column
Visualize the distribution of #of Siblings/Spouses
sns.countplot(x='SibSp',data=titanic)
<matplotlib.axes._subplots.AxesSubplot at 0x23420106ba8>

sns.countplot(x='Parch',data=titanic)
<matplotlib.axes._subplots.AxesSubplot at 0x23420112fd0>

Bi-variate Analysis
Sex with Survival
sns.countplot(x='Survived',hue='Sex',data=titanic)
<matplotlib.axes._subplots.AxesSubplot at 0x2341e085f28>

Fare with Survival
sns.boxplot(x='Survived',y='Fare',data=titanic)
<matplotlib.axes._subplots.AxesSubplot at 0x234201d4668>

It indicated that people those survived had more expensive fares. Also, in People who survived, there was one cost over 500. It might indicate the outliers.
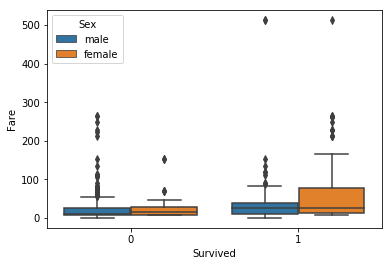
You can also visualize how sex differs with different fare and different sexes
sns.boxplot(x='Survived',y='Fare',hue='Sex',data=titanic)
<matplotlib.axes._subplots.AxesSubplot at 0x2341ee50f98>

We may have to handle fares data
Number of Sibilings/family
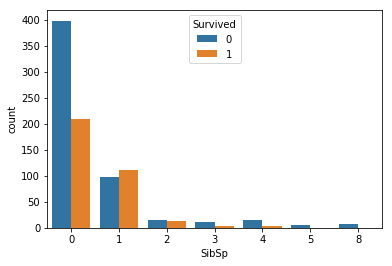
sns.countplot(hue='Survived',x='SibSp',data=titanic)
<matplotlib.axes._subplots.AxesSubplot at 0x2341ee50e48>

People who have one sibling/spouse survived more likely that the single people
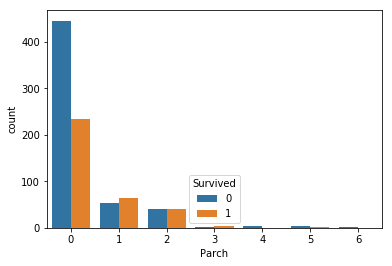
sns.countplot(hue='Survived',x='Parch',data=titanic)
<matplotlib.axes._subplots.AxesSubplot at 0x234200ac2b0>

Missing Values
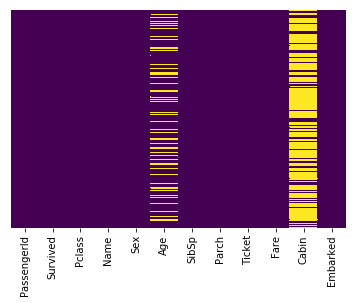
there is missing value in age column and cabin column
titanic.isnull().head()
| PassengerId | Survived | Pclass | Name | Sex | Age | SibSp | Parch | Ticket | Fare | Cabin | Embarked | |
|---|---|---|---|---|---|---|---|---|---|---|---|---|
| 0 | False | False | False | False | False | False | False | False | False | False | True | False |
| 1 | False | False | False | False | False | False | False | False | False | False | False | False |
| 2 | False | False | False | False | False | False | False | False | False | False | True | False |
| 3 | False | False | False | False | False | False | False | False | False | False | False | False |
| 4 | False | False | False | False | False | False | False | False | False | False | True | False |
Visualize the missing values
sns.heatmap(titanic.isnull(),yticklabels=False,cbar=False,cmap='viridis')
<matplotlib.axes._subplots.AxesSubplot at 0x1b0d47885c0>
